Sometimes the same model is fitted to two different populations. For example, an researcher might wish to investigate whether weight predicts blood pressure in smokers and nonsmokers and, if so, whether the regression model fits one group better than the other. The problem with questions like this is that the answer depends on what we mean by better.
It is common to hear investigators speak of the model with the larger coefficient of determination, R2, as though it fits better because it accounts for more of the variability in the response. However, it is possible for the model with the smaller R2 to have the smaller standard error of the estimate and make more precise predictions. Here is a small dataset to illustrate this behavior.
| X | Y | X | Y |
|---|---|---|---|
| 158.2 | 157.8 | 140.4 | 153.2 |
| 214.9 | 146.6 | 211.9 | 157.4 |
| 153.2 | 147.5 | 152.4 | 149.6 |
| 196.0 | 153.1 | 124.7 | 154.9 |
| 88.5 | 143.7 | 103.9 | 145.2 |
| 55.5 | 132.3 | 128.5 | 141.7 |
| 86.4 | 144.3 | 187.1 | 159.7 |
| 223.6 | 169.1 | 168.5 | 145.3 |
| 256.9 | 160.9 | 138.3 | 151.7 |
| 252.4 | 157.1 | 137.9 | 141.7 |
| 20.9 | 141.6 | 203.3 | 153.3 |
| 92.9 | 145.4 | 102.5 | 145.8 |
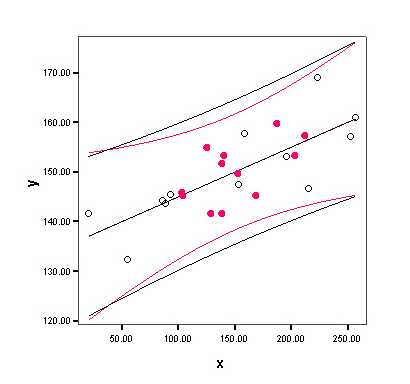
The two data sets need not have the same regression line, but they have been constructed with the same regression line in this example to remove any suspicion that these results might have something to do with the slopes of the regression lines. They don't!
| Y = 134.9 + 0.100 X | ||
|---|---|---|
| R2 | se | |
| Red | 0.36 | 5.04 |
| Black | 0.64 | 6.28 |
The black data set, with open circles and outer prediction bands, has the larger R2. The red data set, with filled circles and inner prediction bands, has the smaller se.
Does the model fit one group better than the other? I try to avoid questions demanding one word answers where the answer depends on the choice of summary measure. However, if pressed, I would argue that the answer is red. R2 is just a disguised correlation coefficient (the square of the correlation between the observed and predicted values). I have yet to encounter a real research question for which the answer is "correlation coefficient". If I were to use "better" in connection with linear regression it would almost certainly have something to do with prediction. The standard error of the estimate (se) estimates the precision of the predictions. The accuracy of the predictions typically determines whether the regression equation will be useful. While the regression equation may account for more variability in the black group, the predictions are more precise in the red group.
R2 can be written as
These results apply when the same model is fitted to two different sets of observations. If two models were fitted to the same set of responses--for example, if weight and amount of exercise were used separately to predict blood pressure in the same set of individuals--then the model for which R2 is larger would necessarily be the model for which se is smaller. That's because Total SS would be the same for both, so the model for which Residual SS/Total SS is smaller must also be the one for which Residual SS is smaller.